
原始信号由20Hz、50Hz和100Hz三种频率的正弦波组成,如上图所示。
在Figure图上画框截取待分析的数据,如下所示:

所得结果如下所示,
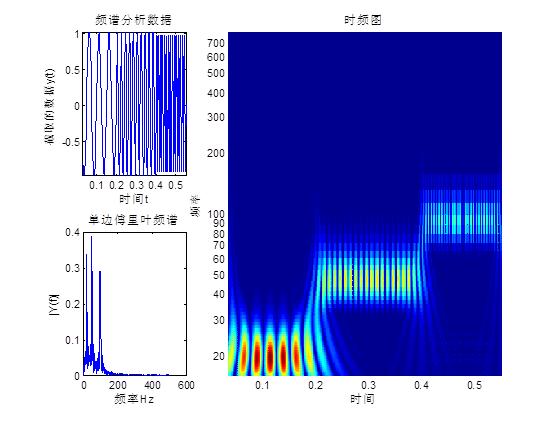

从上图中可以清晰的看出有三种频率,而且从时频图中可以看到三种频率发生在不同时刻。
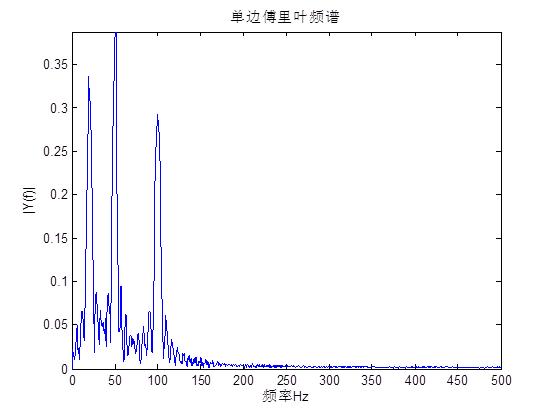
点击单边傅里叶频谱,放大频谱如下:
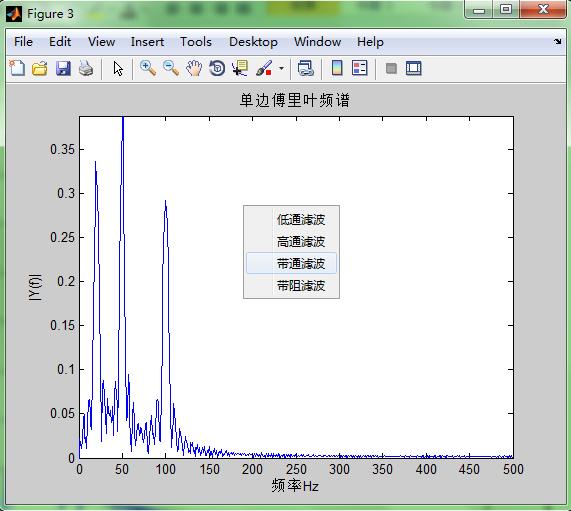
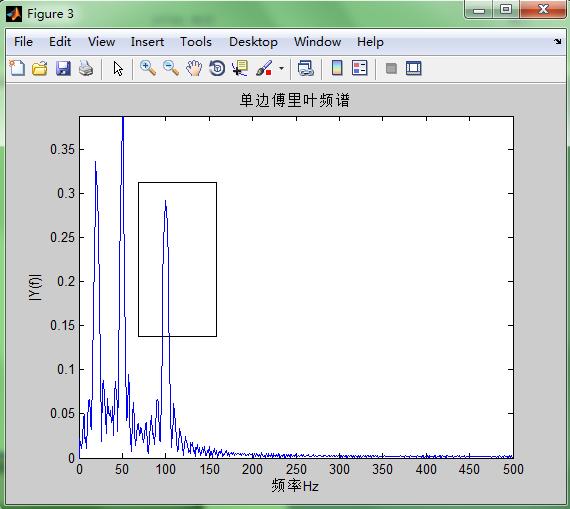
画框可以选定滤波范围,如带通滤波,选择如下框,可得结果:

MATLAB中具体代码如下:
functionfrequency_analysis
clccloseall
Ts=0.001;
Fs=1/Ts;
f1=20;
f2=50;
f3=100;
dt=0.2;
t1=(0:Ts:dt-Ts)+0;t2=(0:Ts:dt-Ts)+dt;
t3=(0:Ts:dt-Ts)+2*dt;
y1=sin(2*pi*f1*t1);
y2=sin(2*pi*f2*t2);
y3=sin(2*pi*f3*t3);
t=[t1t2t3];
y=[y1y2y3];
figure
plot(t,y)
xlim([t(1)t(end)])
ylim([min(y)max(y)])
xlabel(’时间t’)
ylabel(’信号y(t)’)
title(’原始信号’)
%
%以下为标准化程序
%上面的Ts和Fs要给定,后面会用到
set(gcf,’WindowButtonDownFcn’,@BtndownFcn);
functionBtndownFcn(h,evt)
temppt=get(gca,’CurrentPoint’);
startpt.x=temppt(1,1);
startpt.y=temppt(1,2);
endpt=startpt;
height=0.0001;
width=0.0001;
rectangle(’Position’,[startpt.x,startpt.y,width,height],’Tag’,’rangerect’);set(h,’WindowButtonMotionFcn’,@BtnmoveFcn);
set(h,’WindowButtonUpFcn’,@BtnupFcn);
functionBtnmoveFcn(h,’CurrentPoint’);
endpt.x=temppt(1,1);
endpt.y=temppt(1,2);
width=abs(endpt.x-startpt.x)+0.00001;
height=abs(endpt.y-startpt.y)+0.00001;
hrect=findobj(’Tag’,’rangerect’);
set(hrect,’Position’,[min(startpt.x,endpt.x),min(startpt.y,endpt.y),height]);
end
functionBtnupFcn(h,evt)
set(h,’’);
set(h,’’);
hrect=findobj(’Tag’,’rangerect’);
delete(hrect);
BtnUp_Spectrum_Analysis(startpt.x,endpt.x)
end
%频谱分析
functionBtnUp_Spectrum_Analysis(starttime,endtime)
hline=findobj(gca,’type’,’line’);
time=get(hline,’xdata’);
laser=get(hline,’ydata’);
%得到截取的分析数据
tempx=find(time>=min(starttime,endtime));
startindex=tempx(1);
tempx=find(time<=max(starttime,endtime));
endindex=tempx(end);
yt=laser(startindex:endindex);
yt=ytmean(yt);
t=time(startindex:endindex);
%傅里叶变换
[Yf,f]=Spectrum_Calc(yt,Fs);
%小波变换
scale=1:50;
cw2=cwt(yt,scale,’morl’);
%作图
figure
subplot(231)
%截取的频谱分析的数据
plot(t,yt)
xlim([t(1)t(end)])
ylim([min(yt),max(yt)]);
title(’频谱分析数据’)
xlabel(’时间t’)
ylabel(’截取的数据y(t)’)
h1=subplot(234);
%单边傅里叶变换分析频谱
plot(f,Yf,’-’)
title(’单边傅里叶频谱’)
xlabel(’频率Hz’)
ylabel(’|Y(f)|’)
set(h1,’ButtonDownFcn’,@BtnDown_Filter_fcn)
functionBtnDown_Filter_fcn(h,evt)
fig_fft=figure;
plot(f,’-’)
title(’单边傅里叶频谱’)
xlabel(’频率Hz’)
ylabel(’|Y(f)|’)
xlim([0Fs/2])
ylim([0max(Yf)])
%构造右键菜单
filter_flag=1;
hcmenu=uicontextmenu;
uimenu(hcmenu,’Label’,’低通滤波’,’Callback’,@hcb1);
uimenu(hcmenu,’高通滤波’,@hcb2);
uimenu(hcmenu,’带通滤波’,@hcb3);
uimenu(hcmenu,’带阻滤波’,@hcb4);
set(gca,’UIContextMenu’,hcmenu);
functionhcb1(h,evt)
filter_flag=1;
end
functionhcb2(h,evt)
filter_flag=2;
end
functionhcb3(h,evt)
filter_flag=3;
end
functionhcb4(h,evt)
filter_flag=4;
end
set(fig_fft,evt)
if
strcmp(get(h,’SelectionType’),’normal’)
temppt=get(gca,
[startpt.x,’rangerect_fft’);set(h,@BtnupFcn);
end
functionBtnmoveFcn(h,2);
width=abs(endpt.xstartpt.x)+0.00001;
height=abs(endpt.ystartpt.y)+0.00001;
hrect=findobj(h,’rangerect_fft’);
set(hrect,’’);
hrect=findobj(h,’rangerect_fft’);
delete(hrect);
Filter_Analysis(startpt.x,endpt.x);
functionFilter_Analysis(x1,x2)
lowfre=min(x1,x2);
highfre=max(x1,x2);
if
lowfre<=0||lowfre>=Fs/2
lowfre=0.01;
end
if
highfre<=0||highfre>=Fs/2
highfre=Fs/2-0.01;
end
W1=lowfre/(Fs/2);
W2=highfre/(Fs/2);
filter_str=’(低通)’;
switchfilter_flag
case1
[b,a]=butter(5,min(W1,W2));%低通,画的框的左边为截止频率
filter_str=’(低通)’;
case2
[b,max(W1,W2),’high’);%高通,画的框的右边为截止频率
filter_str=’(高通)’;
case3
[b,[W1W2]);%带通
filter_str=’(带通)’;
case4
[b,[W1W2],’stop’);%带阻
filter_str=’(带阻)’;
end
y=filter(b,a,yt);
figure
subplot(2,1,1)
plot(t,yt)
xlabel(’时间t’)
ylabel(’信号y’)
xlim([t(1)t(end)])
ylim([min(yt),max(yt)]);
title(’原始信号’)
subplot(2,2)
plot(t,y)
xlabel(’时间t’)
ylabel(’信号y’)
xlim([t(1)t(end)])
ylim([min(y),max(y)]);
title(sprintf(’滤波信号%s%.2fHz~%.2fHz’,filter_str,lowfre,highfre))
end
end
end
end
subplot(1,3,[2,3])%频率轴化为频率
[X,Y]=meshgrid(t,5/(2*pi)./scale*Fs);
mesh(X,Y,abs(cw2))
view(0,90)
title(’时频图’)
xlabel(’时间’)
ylabel(’频率’)
xlim([t(1)t(end)])
set(gca,’ylim’,[0,max(max(Y))])
set(gca,’YScale’,’log’)
set(gca,’YTick’,[1:9,10:10:90,100:100:900,1000,2000])
function[Yf,Fs)
L=length(yt);
NFFT=2^nextpow2(L);
Yf=fft(yt,NFFT)/L;
Yf=2*abs(Yf(1:NFFT/2+1));
f=Fs/2*linspace(0,NFFT/2+1);
end
end
end
end
其中选框的代码可以标准化,可以用来在用户交互中用户选择范围,代码整理如下
set(gcf,’rangerect’);
delete(hrect);
%ProsessFcn(startpt,endpt);
%选完框后对选择的范围处理
end
end


 从“风暴眼”到“新航标”:新紫光的升级启示录
 ROHM推出“PFC+反激控制参考设计”,助力实现更小巧的电源设计!
 Cadence 率先推出业内首款 LPDDR6/5X 14.4Gbps 内存 IP,为新一代 AI 基础架构助力
 恩智浦推出全新电芯控制系列IC,赋能新能源解决方案


 慧聪电子网微信公众号
 慧聪电子网微信视频号

精彩评论